Analytics API
Aggregate call data with flexible grouping and metrics for custom reports and dashboards.
Overview
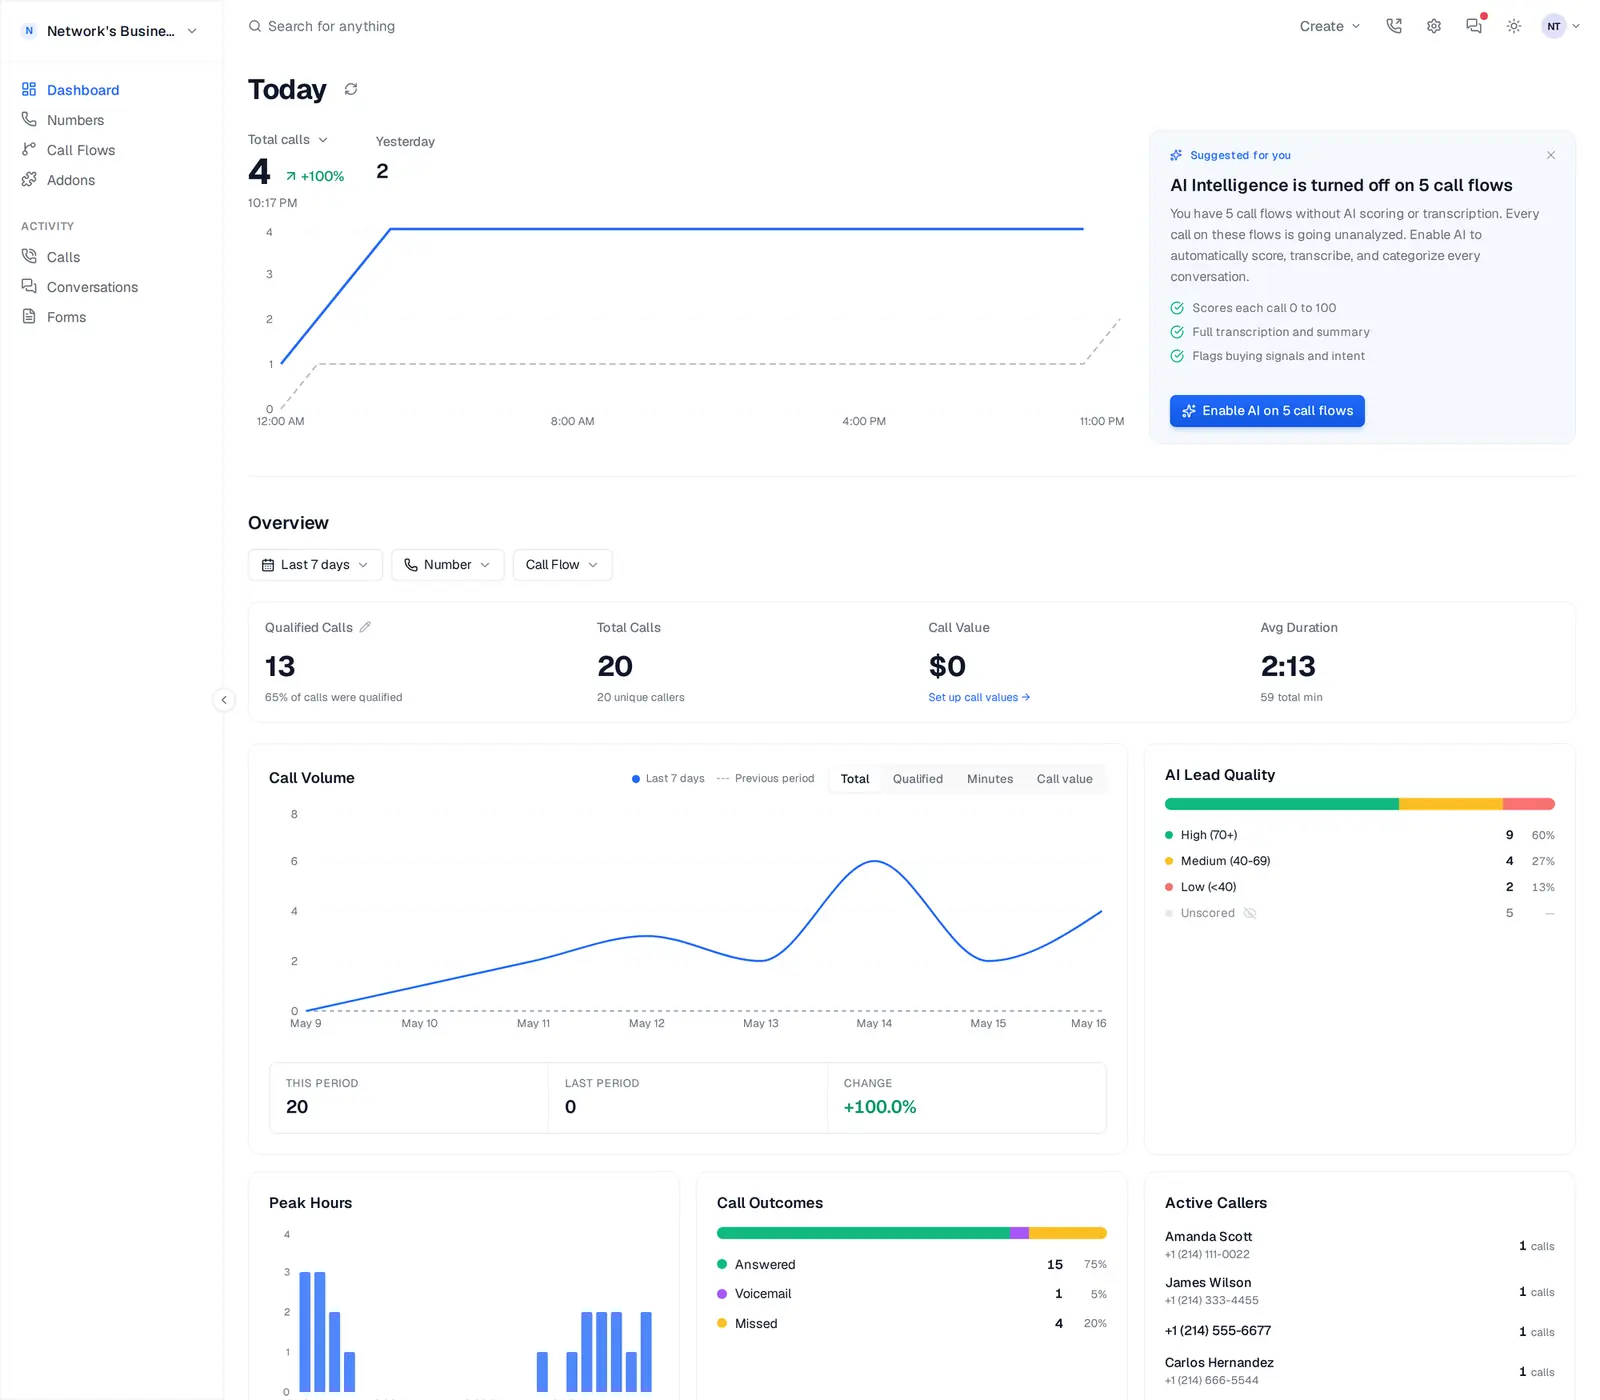
The Analytics API lets you build custom reports by grouping calls and calculating metrics — without downloading raw call data. Use it for campaign performance reports, time-of-day analysis, source ROI, and anything else you'd build in a spreadsheet. The Dashboard's Call Volume chart below is one example of what this endpoint produces — same aggregation under the hood, rendered as a line chart instead of JSON.
GET /api/v1/analytics/calls
curl -H "Authorization: Bearer cs_key_..." \
  "https://callscaler.com/api/v1/analytics/calls?group_by=source&metrics=count,qualified_pct,avg_ai_score"
How It Works
Every request has three parts:
1. group_by — How to bucket the data (by source, campaign, date, etc.)
2. metrics — What to calculate for each bucket (count, averages, percentages)
3. filters — Which calls to include (date range, status, AI score, etc.)
The response includes a data array with one row per group, plus a totals object with the same metrics across all matching calls.
Group By
Choose how to bucket your data. You can combine up to 3 fields (comma-separated) for cross-tabulation.
- •
source— Traffic source (google, facebook, direct, etc.) - •
utm_source— UTM source parameter - •
utm_medium— UTM medium parameter - •
utm_campaign— UTM campaign parameter - •
utm_term— UTM term parameter - •
call_flow— Call flow name - •
call_flow_id— Call flow UUID - •
tracking_number— Tracking number - •
number_id— Number UUID - •
ai_category— AI category (lead, spam, etc.) - •
status— Call status (completed, no-answer, etc.) - •
direction— Inbound or outbound - •
date— Date (daily buckets) - •
week— Week (weekly buckets) - •
month— Month (monthly buckets) - •
hour_of_day— Hour of day (0–23) - •
day_of_week— Day of week (0 = Sunday, 6 = Saturday)
Metrics
Choose what to calculate for each group. Combine as many as you need (comma-separated).
- •
count— Total calls (default) - •
avg_duration— Average duration in seconds - •
total_duration— Total duration in seconds - •
avg_ai_score— Average AI quality score - •
qualified_count— Number of qualified calls - •
qualified_pct— Percentage of calls that are qualified - •
total_value_cents— Total assigned call value in cents - •
unique_callers— Number of unique phone numbers - •
answered_count— Calls with statuscompleted - •
missed_count— Calls with statusno-answer - •
voicemail_count— Calls with statusvoicemail - •
avg_robo_score— Average robocall score - •
total_cost_cents— Total call cost in cents
Filters
Narrow down which calls are included in the calculation.
- •
start_date/end_date— Date range (YYYY-MM-DD) - •
status— Filter by call status - •
source— Filter by traffic source - •
direction—inboundoroutbound - •
call_flow_id— Filter by call flow UUID - •
number_id— Filter by number UUID - •
number_group_id— Filter by number group UUID - •
min_ai_score/max_ai_score— AI score range - •
ai_category— Filter by AI category - •
qualified—trueorfalse - •
min_duration— Minimum duration in seconds
Sorting & Limits
Control the order and number of results.
- •
sort_by— Sort by any metric or group_by field (default:count) - •
sort_order—desc(default) orasc - •
limit— Maximum rows to return (default 100, max 1000)
Response Format
The response includes grouped results and totals across all matching calls:
{
  "data": {
    "data": [
      {
        "source": "google",
        "count": 99,
        "qualified_pct": 74.7,
        "avg_ai_score": 69
      },
      {
        "source": "facebook",
        "count": 42,
        "qualified_pct": 71.4,
        "avg_ai_score": 71
      }
    ],
    "totals": {
      "count": 231,
      "qualified_pct": 60.6,
      "avg_ai_score": 67
    },
    "count": 5
  }
}
Example: Campaign Performance
Compare conversion rates across ad campaigns for the current month:
curl -H "Authorization: Bearer cs_key_..." \
  "https://callscaler.com/api/v1/analytics/calls?group_by=utm_campaign&metrics=count,qualified_pct,avg_duration,avg_ai_score&start_date=2026-03-01&end_date=2026-03-31&sort_by=qualified_pct&sort_order=desc"
Example: Daily Call Volume
Get a daily call volume chart for the last 30 days:
curl -H "Authorization: Bearer cs_key_..." \
  "https://callscaler.com/api/v1/analytics/calls?group_by=date&metrics=count,answered_count,missed_count&start_date=2026-03-01&end_date=2026-03-31&sort_by=date&sort_order=asc&limit=31"
Example: Best Hours to Call
Find your highest-performing hours by combining hour and day grouping:
Use this to optimize staffing — you'll see exactly when call volume peaks and which hours produce the longest (most engaged) calls.
curl -H "Authorization: Bearer cs_key_..." \
  "https://callscaler.com/api/v1/analytics/calls?group_by=hour_of_day,day_of_week&metrics=count,avg_duration&sort_by=count&sort_order=desc&limit=10"
Example: Source ROI
Compare the value of calls from each traffic source:
curl -H "Authorization: Bearer cs_key_..." \
"https://callscaler.com/api/v1/analytics/calls?group_by=source&metrics=count,qualified_count,qualified_pct,total_value_cents,unique_callers&sort_by=total_value_cents&sort_order=desc"On this page